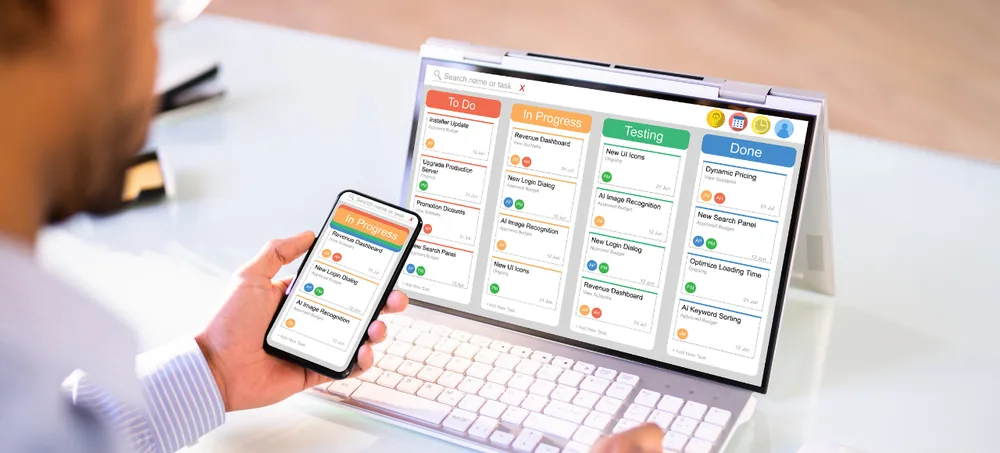
Monitor sales, finance, inventory, production, CRM, HR and operational KPIs through one interactive business dashboard.
Schedule a free consultation with our dashboard & analytics team
Businesses generate information through sales orders, customer enquiries, purchases, inventory movements, production activities, employee attendance, expenses, invoices and payments.
Having this data is not enough. Without a centralized ERP Reporting Dashboard, businesses face delayed management reports, different figures across departments, excessive spreadsheet dependency and reports that are outdated by the time they're reviewed.
ERPLax connects reporting with actual ERP transactions. As users enter orders, purchases, stock movements, production updates, expenses and payments, related dashboards update according to configured data-refresh rules — giving management a clearer view without asking every department to prepare separate reports.
ERP Dashboard Software is a reporting and data-visualization system that presents important ERP information through charts, KPI cards, tables, graphs, alerts and interactive reports — converting detailed transaction data into an easier-to-understand visual format.
Users can filter information by date, location, department, customer, salesperson, product, category, project or other business dimensions.
A Custom ERP Dashboard is designed around what matters to a particular business. Owners may need financial and operational summaries, while sales managers, production supervisors and warehouse teams require more detailed departmental ERP Analytics Dashboard views.
Eight reasons businesses move from spreadsheets to a connected Business Dashboard Software.
A Real-Time ERP Dashboard reduces manual exports and spreadsheet combining by displaying current information directly.
Defined data sources, filters and formulas mean every authorized user reviews information based on consistent rules.
Management Dashboard Software brings revenue, expenses, inventory, receivables and employee activity into one view.
Dashboards highlight unusual changes, overdue transactions and declining performance before they escalate.
Automated reports and summaries reduce repeated data compilation across department teams.
Department-specific dashboards make pending work and performance indicators more visible to managers.
A Cloud ERP Dashboard and Operational Dashboard Software give consolidated and location-wise information across branches, plants and stores.
Add new dashboard pages, KPIs, filters and data sources as operations grow — without replacing the ERP.
Every role gets the view that matters to their work.
High-level view of revenue, profit, cash position and branch comparison for directors and founders.
Department targets, pending transactions, approval requests and performance trends for managers.
Revenue, receivables, payables, cash balances, budget vs actual and branch-wise profitability.
Targets, order value, sales by salesperson/branch/product and margin analysis.
Leads, opportunities, conversion rate, follow-ups due and lost-reason analysis.
Stock value, fast/slow-moving items, stock ageing and pending transfers.
Requisitions, open POs, supplier performance and outstanding payments.
Planned vs actual production, work orders, machine utilization and wastage.
Shift-wise output, machine status, job priority and expected completion dates.
Headcount, attendance, leave requests, turnover and payroll summary.
Progress, overdue tasks, budget vs actual cost and resource utilization.
Open tickets, response time, SLA status and technician workload.
A complete ERP Business Intelligence Software covering KPIs, visuals, filters and access control.
An ERP KPI Dashboard built around your goals and calculation methods.
A Real-Time ERP Dashboard that updates as transactions are processed.
Different users see different information based on responsibility.
Quick numerical summaries for important measurements.
ERP Data Visualization across multiple chart formats.
An Interactive ERP Dashboard that focuses on relevant information.
Summary charts link to detailed transactions.
Compare planned performance with actual results.
Compare current performance with previous periods.
Highlights information that requires attention.
Move from a widget directly to the relevant ERP screen.
A Custom ERP Dashboard arranged around each role.
Organize dashboards by purpose across the business.
Charts supported by interactive transaction-level tables.
KPI formulas configured per your agreed business rules.
Enterprise Dashboard Software consolidating multiple locations.
ERP Reports and Analytics distributed periodically.
Export dashboard and detailed data on demand.
A responsive Cloud ERP Dashboard for browser access anywhere.
Role-based access to financial, operational and customer data.
Important dashboard configuration changes are recorded.
Consolidate ERP and approved external system data.
Monitor activities without waiting for manually prepared reports.
Clear KPIs, trends and alerts help management act sooner.
Bring frequently used reports into the ERP instead of offline files.
Defined formulas and data sources keep every user aligned.
Department dashboards show targets, pending work and results.
Alerts highlight low stock, delayed orders and overdue payments.
View revenue, expenses, receivables and cash through one dashboard.
Monitor stock levels, movement, ageing and replenishment.
Track sales performance, targets, products and customers.
Compare planned and actual production while monitoring delays.
Users and managers see targets, outstanding work and approvals.
Add new KPIs, modules, branches and data sources as you grow.
Dashboards can also be configured for individual departments within larger enterprises.
Essential dashboards that scale as you grow.
Production, machine & quality dashboards.
Inventory and purchase visibility.
Sales, stock and customer dashboards.
Stock movement and fulfilment tracking.
Project progress and budget dashboards.
Project profitability and resource dashboards.
Operational and administrative dashboards.
Enrollment and administrative reporting.
Occupancy, revenue and service dashboards.
Sales, service and parts dashboards.
Industry-specific KPI dashboards.
Business goals, existing reports, data sources and user roles studied.
Each KPI documented with source, formula, period, target and users.
Existing systems reviewed for missing, duplicate or inconsistent data.
Pages, KPI cards, charts and filters arranged around user priorities.
Sales, CRM, inventory, finance, HRM and approved external sources linked.
KPI cards, charts, tables, alerts and export formats configured.
Dashboard values compared with source transactions and manual reports.
Access assigned by department, company, branch and responsibility.
Guidance on filters, KPIs and alerts; new dashboards added as you grow.
Dashboard pages, KPIs, charts and reports built around your actual management needs.
Sales, CRM, inventory, purchase, production, finance, HRM and service in one view.
Calculations configured according to your definitions and reporting structure.
Each user gets dashboards relevant to their department and responsibility.
KPI cards, charts, trends, tables, filters and drill-down reports.
Begin with executive, sales and financial dashboards, add more later.
Choose the approach matching your infrastructure and access needs.
Connect with approved accounting, ecommerce, CRM, POS and warehouse systems.
Alerts, approval reminders, scheduled reports and exception notifications.
Operational, management and executive reports for different users.
Configuration, dashboard validation, training and post-launch support.
Start with essential dashboards and expand as requirements increase.
An ERP Dashboard is a visual reporting screen that displays important business information through KPI cards, charts, graphs, tables and alerts, drawing from sales, inventory, finance, production, CRM and HR modules.
A dashboard provides a visual summary of KPIs and trends, while a report gives more detailed transaction-level information. ERPLax connects dashboard widgets with detailed reports for drill-down.
Yes. ERPLax can configure dashboard layouts, KPI formulas, filters, charts, reports, alerts and user permissions according to your business workflow.
Yes. Dashboard data can be configured for real-time, frequent or scheduled refresh depending on the source system, data volume and reporting requirement.
Dashboards can be created for management, finance, sales, CRM, purchase, inventory, manufacturing, production, HR, projects, ecommerce and customer-service departments.
Yes. Role-based dashboards can be configured for owners, directors, department managers, branch managers, supervisors and employees according to assigned permissions.
Yes. Filters can be provided for date, company, branch, warehouse, department, customer, supplier, salesperson, product, category and project.
Yes. Interactive dashboard elements can be configured with drill-down functionality to view related invoices, orders, products or work orders.
Yes. Dashboards can compare sales, production, collections, project progress and employee performance with configured targets.
Yes. Alerts can be configured for low stock, overdue payments, delayed orders, pending approvals and expiring documents, with delivery via configured integrations.
Integration may be possible when the existing software provides an API, database connection or approved data-exchange method, evaluated per system.
Yes. ERPLax can create responsive, browser-based dashboards for supported desktop, tablet and mobile devices, prioritizing key metrics and alerts on smaller screens.
Bring sales, inventory, finance, production, CRM, HR and operational data into one Custom ERP Dashboard.
Call +91 97399 66977 | Email info@erplax.com
Specialized Applications
Purpose-built & ready to deploy. Hover to explore, click to learn more.